Histograms in RGB & CMY: Difference between revisions
From Avisynth wiki
Jump to navigationJump to search
m Images |
→Syntax and Parameters: formatting |
||
| Line 17: | Line 17: | ||
<br> | <br> | ||
== [[Script variables|Syntax and Parameters]] == | == [[Script variables|Syntax and Parameters]] == | ||
<br> | |||
===HistogramRGBLevels / HistogramCMYLevels=== | |||
These two functions are like [[Histogram#Levels_mode|Histogram("levels")]] but for [[RGB]] and CMY instead of [[YUV]]. | |||
<br> | |||
<br> | <br> | ||
:{{Template:FuncDef|HistogramRGBLevels (''clip'' input, ''bool'' "range", ''float'' "factor" )}} | :{{Template:FuncDef|HistogramRGBLevels (''clip'' input, ''bool'' "range", ''float'' "factor" )}} | ||
| Line 28: | Line 32: | ||
<br> | <br> | ||
::{{Par2|factor|float|100.0}} | ::{{Par2|factor|float|100.0}} | ||
:::The "factor" option specifies how the graphs are displayed. It is specified as percentage of the total population. | |||
:::Range: 0.0 to 100.0 | :::Range: 0.0 to 100.0 | ||
<br> | |||
--------- | |||
<br> | |||
===HistogramRGBParade=== | |||
Presents a fairly standard [[RGB]] parade color scope. It uses Histogram("classic") for each [[RGB]] component, but applied to columns rather than rows. | |||
<br> | <br> | ||
<br> | <br> | ||
:{{Template:FuncDef|HistogramRGBParade (''clip'' input, ''float'' "width" )}} | :{{Template:FuncDef|HistogramRGBParade (''clip'' input, ''float'' "width" )}} | ||
<br> | <br> | ||
| Line 41: | Line 49: | ||
::::Controls the width of the histogram display (height will always be 256 pixels). | ::::Controls the width of the histogram display (height will always be 256 pixels). | ||
<br> | <br> | ||
== Examples == | == Examples == | ||
*HistogramRGBLevels with default settings: | *HistogramRGBLevels with default settings: | ||
Revision as of 12:42, 7 September 2014
| Abstract | |
|---|---|
| Author | -Vit- |
| Version | 2012/04/20 |
| Download | Histograms in RGB & CMY.avsi |
| Category | Levels and Chroma |
| License | |
Description
- A script to display RGB and CMY levels and a RGB parade color scope.
- HistogramRGBLevels / HistogramCMYLevels are like Histogram("levels") but for RGB and CMY instead of YUV.
- HistogramRGBParade presents a fairly standard RGB parade color scope. It uses Histogram("classic") for each RGB component, but applied to columns rather than rows.
Requirements
- - AviSynth 2.5.8 or later
- - Supported color formats: RGB24, RGB32, Y8, YUY2, YV411, YV12, YV16, YV24
HistogramRGBLevels / HistogramCMYLevels
These two functions are like Histogram("levels") but for RGB and CMY instead of YUV.
- HistogramRGBLevels (clip input, bool "range", float "factor" )
- HistogramCMYLevels (clip input, bool "range", float "factor" )
- clip input =
- Input clip.
- clip input =
- bool range = true
- Set range=false to hide the 16-235 range (a left-over from the Y histogram used to build these)
- bool range = true
- float factor = 100.0
- The "factor" option specifies how the graphs are displayed. It is specified as percentage of the total population.
- Range: 0.0 to 100.0
- float factor = 100.0
HistogramRGBParade
Presents a fairly standard RGB parade color scope. It uses Histogram("classic") for each RGB component, but applied to columns rather than rows.
- HistogramRGBParade (clip input, float "width" )
- clip input =
- Input clip.
- clip input =
- float width = 0.25
- Controls the width of the histogram display (height will always be 256 pixels).
- float width = 0.25
Examples
- HistogramRGBLevels with default settings:
AviSource("blah.avi")
HistogramRGBLevels(range=true, factor=100.0)
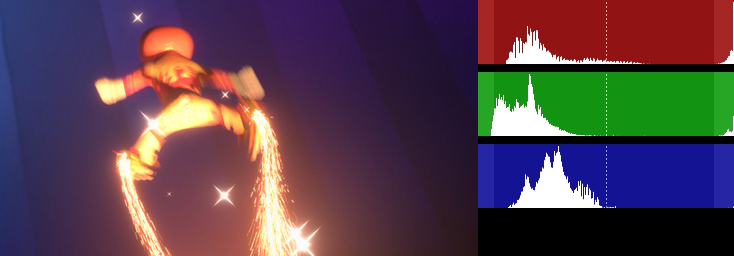

- HistogramCMYLevels with default settings:
AviSource("blah.avi")
HistogramCMYLevels(range=true, factor=100.0)
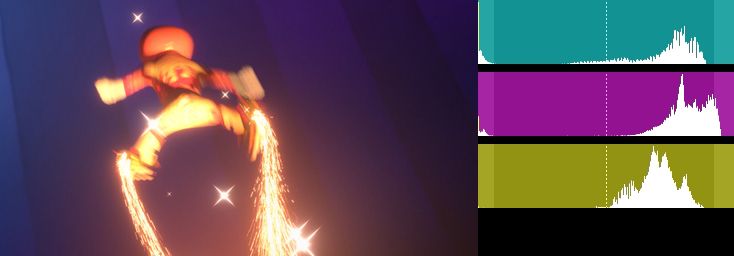

- HistogramRGBParade with default settings:
AviSource("blah.avi")
HistogramRGBParade(width=0.25)
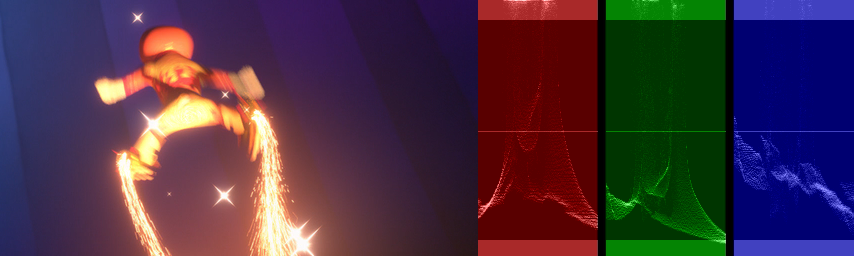

Changelog
Version         Date            Changes

2012/04/20      2012/04/20      - Initial release
Links
- Doom9 Forum - Histograms in RGB & CMY discussion.
Back to External Filters ←
